Web application performance is not only a healthy goal to strive for in 2017, it can also significantly impact your business. Websites and web services that load quickly have better engagement and conversion rates. Google found that a half second increase in page load time (from 0.4 to 0.9s) caused a 20% drop in traffic and revenue . For Amazon, every 100ms increase in load times decreased sales by 1%.
“The basic advice regarding response times has been about the same for thirty years [Robert B Miller 1968; Card et al. 1991]:
- 0.1 second is about the limit for having the user feel that the system is reacting instantaneously, meaning that no special feedback is necessary except to display the result.
- 1.0 second is about the limit for the user’s flow of thought to stay uninterrupted, even though the user will notice the delay. Normally, no special feedback is necessary during delays of more than 0.1 but less than 1.0 second, but the user does lose the feeling of operating directly on the data.
- 10 seconds is about the limit for keeping the user’s attention focused on the dialogue. For longer delays, users will want to perform other tasks while waiting for the computer to finish, so they should be given feedback indicating when the computer expects to be done. Feedback during the delay is especially important if the response time is likely to be highly variable, since users will then not know what to expect.”
https://www.nngroup.com/articles/response-times-3-important-limits/

So why is it that so many web applications simply don’t perform well in 2017? Simply put, web performance is a shared goal between engineering and UX teams. Traditionally web application performance is perceived to be part of the web development team’s domain. As a web developer, we’ve looked at all the wrong things. I’ll admit, I’m guilty of digging deep into Chrome DevTools, attempting to profile a memory leak or selecting the fastest loop operation. Occasionally I’ll claim I’m optimizing my application by selecting the latest framework or using techniques like tree shaking to improve download size. That might save me a couple bytes or optimize network requests. But none of these things truly improve web application performance. These are simply indicators that our web application may not be performing as well as it could or should. And performance is a characteristic defined by users, not necessarily technical statistics.
Where do we go from here? Understanding that web application performance is defined by our users allows us to tie together the human expectation of response times (listed above) and technical efficiencies. Google has studied and expanded performance research and identified the RAIL model as a method to approach performance improvements. RAIL stands for Response, Animation, Idle, and Load. It allows cross-functional teams, including engineers and UX teams to quantify the user perception of your web application’s performance.
Response
Key Metric: less than 100ms
Input latency should be under 100ms. When a user taps, touches, or performs some action the web application should respond in a meaningful manner in less than 100ms.
Goal: Your application should actively provide a feedback loop to your users. In less than 100ms your users should either see the results of their action or some indication that the web application has received their input. If the user performs a long running operation they should see a progress indicator or an indication that their request has been received in less than 100ms.
Animation
Key Metric: less than 16ms
Each (request) frame should complete all operations from executing javascript to painting in under 16ms. This allows for a web application to operate at 60 frames per second.

Goal: Your users should perceive your web application as a continuously interactive and engaging. Commonly in data-driven sites, you can see an example of poor animation performance when scrolling begins to stutter (commonly known as “jank”). This is usually an indication that a developer should begin profiling the web application and determine what operations are slowing down the web application.
Idle
Key Metric: Main thread occupied less than 50ms
The main thread within javascript should be chunked so that operations should take no longer than 50 ms.
Goal: Web applications perform best when operations can be performed in small incremental events. For long running operations or operations that may require concurrency developers should consider using web workers. For operations that rely on XHR or Fetch requests, consider using service workers in combination with caching operations. Optimizing how much work is executed within a web application will also greatly improve animations and responsiveness.
Load
Key Metric: Page ready in less than 1000ms
User loads the page and is able to see the critical rendering path in less than 1000ms.
https://developers.google.com/web/fundamentals/performance/critical-rendering-path/
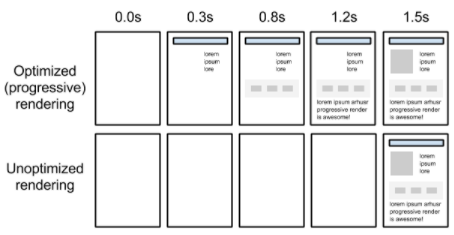
Goal: Web applications work best when they can be chunked (check out idle). Traditionally SPA and server request / response apps return all the results at once. Instead try to incrementally load content and prioritize content that a user must see first to load first.
If you’re interested in how to resolve many more web application performance issues check out the free course provided by Udacity and Google developers.