
An engagement summary of walkthroughs deployed through our platform
As a data-focused company, we spend a lot of time looking at the usage of our product and analyzing the behavior of our users. One of the things we were looking at recently was some summary statistics about the walkthroughs that users have deployed through our platform, and I thought the data was interesting enough to share.
Before diving in, for those readers that are new to Pendo, a walkthrough is a multi-step in-application guide that “walks” the user step-by-step through a particular process in an application. Walkthroughs are most heavily used for training and user onboarding.
Our analysis looked at the total number of steps across all the different active walkthroughs as well as the completion and abandonment rate for each step in a given walkthrough. Overall we had quite a range in the number of steps that people setup in a walkthrough with the smallest having only 1 or 2 steps, while the largest has 74 steps (it is a bit of an outlier). The average number of steps is 6.4, but most walkthroughs deployed in our platform have between 1 and 3 steps – about 40% of them.
Abandonment Rates by Walkthrough Step
Across all of the walkthroughs we looked at the total number of views for each step to see on average how many visitors drop off of a walkthrough at each point in the guide.
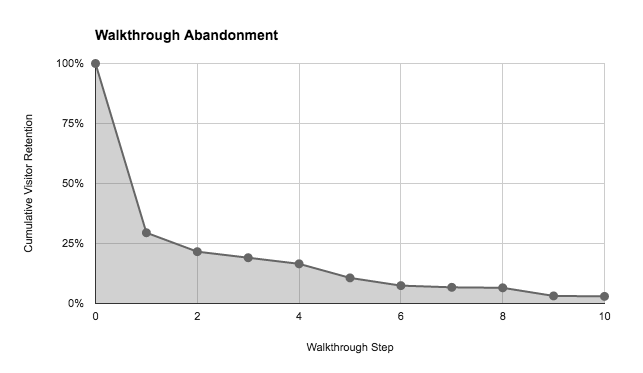
Unsurprisingly the biggest drop-off occurs after the first step. When users are first presented with a walk-through, they make a quick decision as to how relevant the training content will be for them, and will more often than not dismiss the guide. Following that initial drop-off, we see a fairly gradual decline with another steep drop-off after the 10th step – about 50% of the remaining visitors.
Total Completion Rates
Although walkthroughs lose visitors at each step, even longer training flows can retain users all the way through if the content is compelling. We looked at the total completion rate (the percentage of visitors that completed all steps in a walkthrough) across different walkthrough lengths.
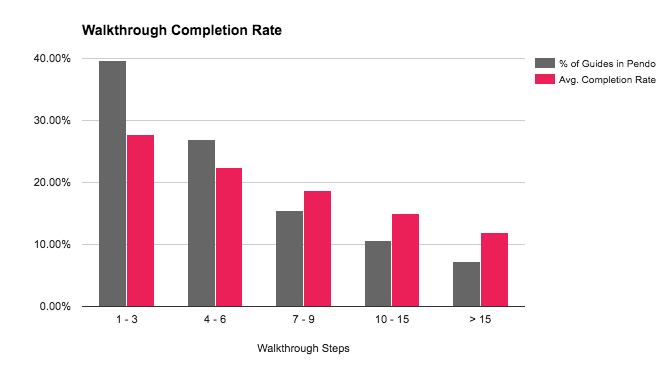
As expected, shorter walkthroughs have the highest completion rate, with 1 – 3 step walkthroughs having a nearly 30% completion rate. However, slightly longer walkthroughs don’t see a significant drop-off in overall conversion rate. Walkthroughs with more than 10 steps, were much lower – nearly 2x lower overall completion rates than walkthroughs with 1 – 3 steps.
Takeaways
What to take away from the analysis? Well first, a couple of caveats. These reports summarize walkthrough data from a wide range of companies, with diverse user bases and use cases. Some walkthroughs are viewed by thousands of visitors, while others only have a few viewers. These variations can have a lot of impact on the approach and the engagement with a guide. It’s important to keep this in mind when looking at summary data.
That having been said, there are a couple of interesting things that jump out from what we see. First is how high the abandonment rate is after the first step in a walkthrough. Nearly 70% of visitors will elect to dismiss a walkthrough before advancing at all. It’s therefore really critical that the walkthrough is targeted to the right user segment, and that the initial content/description is compelling. If a walkthrough is not relevant to a user either because of their profile or their previous behavior in the app, it shouldn’t be shown to them. As I wrote in an earlier post – the best guide is one a user never sees.
Secondly, it’s pretty clear that user engagement drops off precipitously for walkthroughs that have a large number of steps. Their overall completion rate is less than half that of shorter ones. If you find yourself building a very long walkthrough, you may want to take a step back, and assess what you’re trying to accomplish. Could it be broken into smaller modules? What user behavior are you trying to drive? Is the same for all user segments? Sometimes a longer walkthrough may be unavoidable, but oftentimes it can be broken down into smaller groups targeted to different user segments. This approach will give you a better chance of keeping users engaged throughout your training flow.
To learn more about best practices with guides, see how Josiah Wang implements in-app user guidance for VTS in our recent webcast.